 Lila Modeler
Reference behaviour checklist (Bizagi Modeler public docs)
Source: LILA_MODELER_ESTRUCTURA.md, section 3 ("Checklist de paridad con Bizagi" — internal acceptance criterion, not the public positioning). This table is a copy of that section with a Status column added for implementation tracking; the content of the Capability/Bizagi Modeler/Lila/Milestone columns is the same as in the structure document, which remains the source of truth — for any discrepancy between this file and LILA_MODELER_ESTRUCTURA.md, the structure document wins and this file is corrected to match it, never the other way around.
Source of the original comparison: Bizagi's official help pages (levels 1-4, scenarios, unsupported elements), verified on 2026-09-03. Bizagi does not expose "4 levels" in its engine: they are just which parameters happen to be filled in. Lila does not reproduce the levels as a product concept; the engine degrades gracefully instead: no resources ⇒ infinite capacity, no calendar ⇒ 24×7. Bizagi Modeler is cited here only as a technical reference and inspiration: this document does not claim that Lila matches Bizagi as a product, or that it is a commercial substitute for it — only an internal criterion for numeric validation (#289).
Status reflects the implementation status in the repository, not this document's own status. It is updated row by row as each capability gets implemented and tested (see the acceptance test for the corresponding milestone in section 7 of LILA_MODELER_ESTRUCTURA.md), and carries in parentheses the tickets that close it.
The numeric reference behaviour, meaning validation against the runs Bizagi Modeler publishes, is checked in packages/engine/test/bizagi-parity.test.ts
(LILA-044), which simulates the four examples in examples/bizagi-levels and compares every number
expected.json cites from the official page with a ±5% tolerance. What does not match today is in
the Documented differences section at the end, with its cause and its figure: none of those
differences has been closed by tweaking a parameter of the published scenario.
This file is an internal technical reference and keeps its historical name
(BIZAGI_PARITY.md, bizagi-parity.test.ts) for continuity with the code and the tickets that
cite it; it does not imply a public promise that Lila matches Bizagi Modeler.
| Capability | Bizagi Modeler | Lila | Milestone | Status |
|---|---|---|---|---|
| Start/End none, task (all variants), sequence flow | ✓ | ✓ | M1 | Implemented (LILA-018, LILA-021, LILA-026) |
| Exclusive gateway with % per flow (equal split by default) | ✓ | ✓ | M1 | Implemented (LILA-026); matches the published results at level 1 (test) |
| Inclusive gateway with independent % | ✓ | ✓ | M1 | Implemented (LILA-026) |
| Parallel gateway fork/join | ✓ | ✓ | M1 | Implemented (LILA-026); matches the published results on the Red branch of levels 2-4 |
| Embedded subprocess (flattened); reusable = task with a global time | ✓ | ✓ | M1 | Implemented (LILA-019) |
| Intermediate timer as a delay | ✓ | ✓ | M1 | Implemented (LILA-026) |
| Arrivals: max arrival count + interval (constant or distribution) | ✓ | ✓ | M1 | Implemented (LILA-026). triggerCount without interTriggerTimer = N arrivals at t = 0, like Bizagi's level 1 (R-ARR-1, LILA-186); see difference D1 |
| Processing time per task/event, constant or distribution | ✓ | ✓ | M1 | Implemented (LILA-026); matches the published results at level 2 |
| Distributions: the 13 from BPSim 2.0 + constant + empirical | ✓ (undocumented subset) | ✓ all | M1 | Implemented (LILA-025) |
| Scenario: name, description, author, version, start, duration, time unit, currency, replications, seed | ✓ | ✓ (+ warmup, extends) |
M1 | Implemented (LILA-013, LILA-014) |
| Stop: duration or max arrival count, whichever comes first | ✓ | ✓ | M1 | Implemented (LILA-026); matches the published results (the official run drains its 2017 cases, see D4) |
| Resources: role/team type, availability, fixed cost per token, hourly cost | ✓ | ✓ | M2 | Implemented (LILA-033); matches the published results at level 3 (test): utilization and cost for all six resources, across the two published runs (3 and 2 nurses), all within ±5% since D8 was resolved |
| Task assignment: one or several resources, quantity, AND / OR | ✓ | ✓ | M2 | Implemented (LILA-034, LILA-035) |
| Fixed cost per activity | ✓ | ✓ | M2 | Implemented (LILA-036); matches the published results at level 3 (8,057.6 against 8,063, −0.07%). No table publishes the 8,063 figure: it is derived from the per-task fixedCost values in the problem statement and the published instance counts (2·2017 + 1·2017 + 1·1006 + 1·1006), and the test states this explicitly |
| Per-element outputs: started, completed, time min/max/avg/total, wait min/max/avg/std/total, fixed cost | ✓ | ✓ same column names | M2 | Implemented (LILA-036); column names checked against RESULTS_FORMAT.md. The numeric match that is actually tested is at the process level and for the level-3 resources (see D6 for the saturated case); the per-element columns are not pinned row by row |
| Per-resource outputs: utilization %, fixed cost, unit cost, total cost | ✓ | ✓ | M2 | Implemented (LILA-036); matches the published results at level 3, all six rows of the published table (e.g. nurse 69.65% against 69.75%) |
| Calendars: recurrence, start time, duration, validity; resource × calendar matrix with a default calendar | ✓ | ✓ weekly, monthly (day N of the month, or the first…fifth/last weekday) and annual (fixed date) recurrence, plus holidays (#82, R-CAL-12 … R-CAL-14). Not covered: "every N weeks/months" recurrence, a validity range for the calendar, and its own timezone with DST (timezone stays reserved; R-CAL-15) |
M3 | Implemented (LILA-040, LILA-041, LILA-164, #82). LILA-164 added per-shift capacity within the same pool (capacity: [{calendar, capacity}], R-CAL-11): with it, level 4 matches — mean cycle time, utilization, and cost for all six resources — except for the utilization denominator, which remains open as D7 and has an exact conversion |
| What-if: several scenarios, side by side, differences highlighted | ✓ | ✓ (lila compare) |
M3 | Implemented (LILA-038, LILA-047) |
| Replications (30 recommended) | ✓ only in what-if | ✓ always, with 95% CI | M2 | Implemented (LILA-027) |
| Results export | Excel | CSV and XLSX | M2 | Implemented (LILA-037, LILA-046, #322) |
Import .bpmn exported by Bizagi |
— | ✓ diagram only: Bizagi does not export simulation parameters (verified on 5 real files, only colors in bizagi:) |
M0 | Implemented (LILA-020) |
| Modeller and deliverables | ||||
| Several processes in one project, with a call activity that drills into another diagram | ✓ a project holds several diagrams; a reusable sub-process (call activity) references another diagram, opened through a navigation window over the model's hierarchy | ✓ repository v2 (#498): canvas tabs, one per process, saved together in the same project; double-click on a call activity whose calledElement matches another process's BPMN process id opens it with a «Back to …» crumb, and double-click on a collapsed sub-process drills down in place. A one-process project still saves byte for byte as the v1 format the beta.14 app reads |
M5 | Implemented (#511, #498, #461) |
| Extended attributes defined once per element type, filled in on each element | ✓ an "Extended Attributes" tab per element, shared across every element of that type, several data types (including a table), exportable for reuse in other models | ✓ text/number/list/date definitions per element type (appliesTo), edited in Properties and listed under each element in the process document; renaming, retyping or deleting a definition that elements already use asks first, and never silently drops a value |
M5 | Implemented (#513, #509) |
| Charts alongside the results tables | ✗ the Results view is a table; "Export to Excel" transfers that same grid. (Bizagi's chart types — line/column/pie — belong to Work Portal's separate Graphical Analysis/BAM, not to Modeler's simulation view) | ✓ bar charts under the Process elements, Resources and Process tables in Results, in Compare, and rasterised into the process document; every bar repeats its table cell's text and value, and missing data gets a note instead of an all-zero chart | M5 | Implemented (#512, #460) |
| Publish the process as a document (Word / HTML) | ✓ «Publish to Word» (also PDF, Excel, MediaWiki, SharePoint): choose which diagrams and elements to include, three built-in templates (Aspose, Bizagi, Modeler) or a custom Word template | ✓ File → Export process document (Word .docx or HTML): cover, diagram, process description, one section per element in flow order grouped by lane, then the scenario and results tables with the run's charts. No templates or table-of-contents field |
M5 | Implemented (#454) |
| Export the diagram as an image and print it | ✓ Export → Image as PNG, SVG or JPG (not PDF directly; PDF is a Publish format; Visio export is separate) | ✓ File → Export as SVG… / PNG… / PDF…, and Print (⌘P/Ctrl+P); SVG keeps the theme's colors on its canvas, PNG/PDF/print use white paper with black strokes, keeping any per-element colors | M5 | Implemented (#451) |
| Extras Bizagi does not offer | ||||
| p50/p90/p95 of cycle time and wait | ✗ | ✓ | M2 | Implemented (LILA-028) |
| Mean/max queue length per activity | ✗ | ✓ | M2 | Implemented (LILA-036) |
| Throughput per hour, cost per case | ✗ | ✓ | M2 | Implemented (LILA-028) |
| Bottleneck ranking | ✗ | ✓ | M2 | Implemented (LILA-036) |
| Event log per case (CSV; XES later) | ✗ | ✓ | M2 | Implemented (LILA-037) |
| Off-hours wait separated from resource wait | ✗ (complaint: "too coarse-grained") | ✓ | M3 | Implemented (LILA-041); this was exactly the metric that exposed the half of D7 that LILA-164 closed (the per-shift-pool workaround created an offHoursWait that Bizagi does not have; it is now 0 across all four level-4 tasks) |
| Seed-based determinism, byte for byte | partial | ✓ | M1 | Implemented (LILA-030, LILA-039, LILA-043) |
| macOS / Windows / Linux / browser | ✗ (4.3 is still Windows-only, no web editor) | partial: web and macOS tested; Windows and Linux built by CI, untested | M5 | Implemented: web app (Chrome tested; Safari pending) and macOS beta (tested). The Windows installer is attached to the beta release but is unsigned and has not been tested on a real Windows machine; the Linux AppImage is built by CI, untested and not attached (platform status) |
| Import scenario parameters from Excel/CSV, reviewed before anything is applied | ✗ (Modeler exports the results grid to Excel; no path back into the simulation parameters was found in the public docs) | ✓ download a filled-in template, import a matching Excel/CSV, review the field-by-field report (unmatched/ambiguous rows and invalid values flagged), then apply or undo | M5 | Implemented (#514, #449) |
| Later | ||||
| Live-counter animation | ✓ | ✓ the tokens on the Results map replay the event log with per-element counters; token-simulation (MIT) keeps the didactic part | — | Implemented (#331) |
| Start quantity / completion quantity | ✓ | reserved | — | Not planned (v1) |
| Interrupting boundary timer on a task | ✓ | ✓ | — | Implemented (#81, first slice: SEMANTICS.md R-BND-1…9) |
| Non-interrupting boundary timer on a task | ✓ | ✓ | — | Implemented (#81, second slice: SEMANTICS.md R-BND-10…14) |
| Event-based gateway (timer and message branches) | ✓ | ✓ | — | Implemented (#81, third slice: SEMANTICS.md R-EVG-1…7) |
| Standalone message/signal/link events, non-timer boundary events, boundary events on a sub-process, parallel or instantiating event-based gateway | partial | explicit validation error until a user asks for it | — | Not planned (v1) |
| Parameters from event logs (Bizagi 4.0 process mining) | ✓ | mining phase (separate Python process) | — | Not planned (v1) |
| No (Bizagi does not simulate these either) | ||||
Multi-instance, complex gateway, choreography/conversation, transactional, ad-hoc; reading the proprietary .bpm |
✗ | ✗ | — | Out of scope |
Documented differences (LILA-044, fixed in LILA-187)
packages/engine/test/bizagi-parity.test.ts simulates examples/bizagi-levels/level-{1..4} exactly
as committed and compares, with a ±5% tolerance, every number its expected.json cites from the
official page. Until LILA-187 the test had two halves — the published replicas, which did not
match, and the same comparison against a separate fixture with the official diagram's topology —
because LILA-044 was forbidden from touching the examples. LILA-187 moved that topology, the
gateway probabilities, and the constant arrivals into the actual model.bpmn and scenario.json
files, so the second half and its fixture disappeared: today there is a single table.
Each row of the test asserts which side of the tolerance its number falls on. If a row switches sides, the test goes red and both the test and this section must be updated together.
Result
Measured with 30 replications in the test (the published scenario.json files stay at 1:
replications are a measurement technique of the test, not a parameter of the examples).
| Level | Published number | Lila | Cause |
|---|---|---|---|
| 1 | 1000 tokens created and completed | 1000 (0%) | — |
| 1 | Red branch (50%) = 483 | 498.9 (+3.3%) | — |
| 1 | Yellow branch (30%) = 315 | 298.1 (−5.4%) | D2 |
| 1 | Green branch (20%) = 202 | 203.0 (+0.5%) | — |
| 1 | branches against 1000 × p (500 / 300 / 200) |
−0.23% / −0.63% / +1.52% | — |
| 2 | 2017 instances started and completed | 2017 (0%) | — |
| 2 | cycle min 16 min | 16 min (0%) | — |
| 2 | cycle max 33 min | 33 min (0%) | — |
| 2 | mean cycle time 25 min 3 s | 25 min 4 s (+0.06%) | — |
| 3 | cycle min 16 min (3 nurses) | 16 min (0%) | — |
| 3 | cycle max 35 min (3 nurses) | 33.1 min (−5.3%) | D5 |
| 3 | mean cycle time 25 min 15 s (3 nurses) | 25 min 4 s (−0.74%) | — |
| 3 | utilization Call center agent 39.91% (3 nurses) |
39.91% (−0.01%) | — |
| 3 | utilization Nurse 69.75% (3 nurses) |
69.65% (−0.14%) | — |
| 3 | utilization Ambulance 49.76% (3 nurses) |
49.63% (−0.27%) | — |
| 3 | utilization Quick attention vehicle 21.40% (3 nurses) |
20.95% (−2.09%) | — |
| 3 | utilization Basic ambulance 19.44% (3 nurses) |
20.21% (+3.96%) | — |
| 3 | utilization Receptionist 19.91% (3 nurses) |
19.85% (−0.30%) | — |
| 3 | utilization Call center agent 38.09% (2 nurses) |
38.09% (+0.01%) | — |
| 3 | utilization Nurse 99.85% (2 nurses) |
99.72% (−0.13%) | — |
| 3 | utilization Ambulance 47.49% (2 nurses) |
47.36% (−0.27%) | — |
| 3 | utilization Quick attention vehicle 20.42% (2 nurses) |
20.01% (−2.03%) | — |
| 3 | utilization Basic ambulance 18.55% (2 nurses) |
19.29% (+4.01%) | — |
| 3 | utilization Receptionist 19.00% (2 nurses) |
18.95% (−0.29%) | — |
| 3 | cycle min 16 min (2 nurses) | 16.07 min (+0.42%) | — |
| 3 | cycle max 10 h 57 min (2 nurses) | 665.8 min (+1.34%) | — |
| 3 | mean cycle time 3 h 39 min 38 s (2 nurses) | 271.3 min (+23.5%) | D6 |
| 3 | activity fixed cost 8,063 (derived, not published) | 8,057.6 (−0.07%) | — |
| 3 | cost Call center agent 6,051 |
6,051.0 (0%) | — |
| 3 | cost Nurse 15,115 |
15,101.5 (−0.09%) | — |
| 3 | cost Ambulance 30,314.13 |
30,232.8 (−0.27%) | — |
| 3 | cost Receptionist 3,018 |
3,009.9 (−0.27%) | — |
| 3 | cost Quick attention vehicle 11,139.86 |
10,907.9 (−2.08%) | — |
| 3 | cost Basic ambulance 9,844.65 |
10,234.6 (+3.96%) | — |
| 3 | all six costs, 2-nurse run | the same values and the same deviations (cost does not depend on capacity) | — |
| 4 | 2017 instances started and completed | 2017 (0%) | — |
| 4 | mean cycle time 25 min 26 s (1,526 s) | 1,521.5 s (−0.30%) | — |
| 4 | offHoursWait of the 4 tasks with a per-shift resource |
0 across all four | — |
| 4 | utilization Call center agent 11.21% |
11.21% (−0.04%) | D7 (converted denominator) |
| 4 | utilization Nurse 16.21% |
16.30% (+0.54%) | D7 (converted denominator) |
| 4 | utilization Ambulance 11.49% |
11.61% (+1.06%) | D7 (converted denominator) |
| 4 | utilization Quick Attention Vehicle 7.55% |
7.35% (−2.60%) | D7 (converted denominator) |
| 4 | utilization Basic Ambulance 5.60% |
5.67% (+1.33%) | D7 (converted denominator) |
| 4 | utilization Receptionist 6.90% |
6.97% (+0.98%) | D7 (converted denominator) |
| 4 | cost Call center agent 6,051 |
6,051.0 (0%) | — |
| 4 | cost Nurse 15,050 |
15,101.5 (+0.34%) | — |
| 4 | cost Ambulance 29,922.4 |
30,232.8 (+1.04%) | — |
| 4 | cost Quick Attention Vehicle 11,193.94 |
10,907.9 (−2.56%) | — |
| 4 | cost Basic Ambulance 10,095.15 |
10,234.6 (+1.38%) | — |
| 4 | cost Receptionist 2,979 |
3,009.9 (+1.04%) | — |
| 4 | Arrive BA max wait 15 min (900 s) | 970 s (+7.78%) | D7 (residual) |
| 4 | Arrive BA mean wait 0.74 min (44.4 s) | 33.5 s (−24.5%) | D7 (residual) |
Levels 1, 2, and 3 match within ±5% except for three documented residuals: D2 (level 1, Yellow
branch against Bizagi's single run) and D5 and D6 (level 3). Level 4 has matched since LILA-164 in
cycle time, utilization, and cost for all six resources; two residuals remain: the two
Arrive at patient place BA waits and — for the utilizations — the denominator conversion, the two
halves of what is now D7. The differences still open today are therefore D2, D5, D6, and D7;
D1, D3, D4, and D8 were resolved in LILA-186/187.
The level-4 utilizations are the ones converted to Bizagi's denominator. Unconverted, Lila
reports them over its own measurement window [warmup, t_stop] = 10,862 min: 44.75% · 64.82% ·
46.18% · 29.79% · 22.24% · 27.36%, in the same order. These are the same busy seconds divided by a
different denominator; the formula is in D7.
Causes
D1 — triggerCount without interTriggerTimer (resolved in LILA-186). This was a gap in
Lila's contract, not a mismatch with Bizagi: R-ARR-1 only generated cases at a start with
interTriggerTimer, so level 1 (max arrival count 1000 and no time field, because level 1 does not
enable them) came out with zero arrivals and the W-START-SIN-LLEGADAS warning. R-ARR-1 now says
that triggerCount without interTriggerTimer is equivalent to the default constant 0, i.e. N
arrivals at t = 0, which is what Bizagi does. The warning remains for a start that declares
neither field.
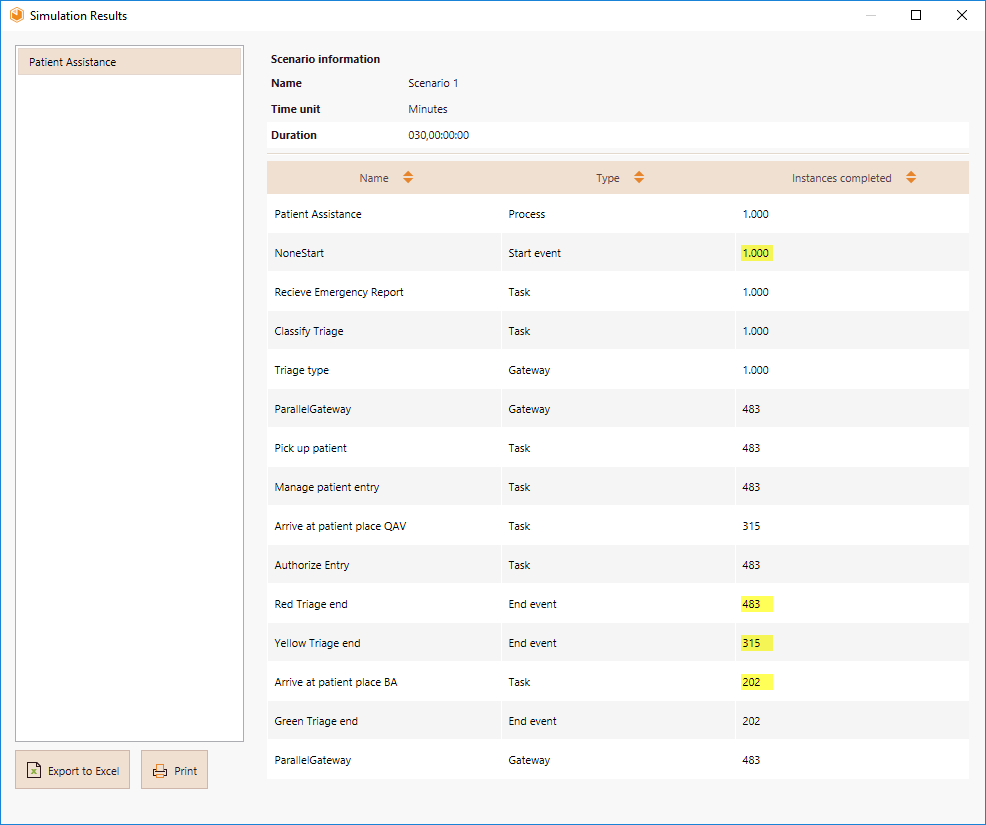
D2 — the 30% branch against a single Bizagi run. The three published counts (483 + 315 + 202)
come from a single 1000-token run; the 315 deviates from its own configured probability (30%) by
+5% on its own. Against 1000 × p, which is what actually validates level 1, all three branches
match (−0.23%, −0.63%, +1.52%). Also noted: level-1/expected.json had the three counts labeled
green/yellow/red backwards (fixed in LILA-187). The page's prose only gives the sum
"(483+315+202)", but the results table next to it
(processvalidation42.png) publishes
them row by row: "Red Triage end 483 · Yellow Triage end 315 · Green Triage end 202". The broken-out
run (processvalidation43.png)
confirms this reading: "Red Triage end 1006 · Yellow Triage end 311 · Green Triage end 186", and the
1006 can only be the Parallel Gateway branch without convergence.

D3 — the reconstructed topology for levels 2-4 was not the official diagram's (resolved in
LILA-187). examples/bizagi-levels/level-{2,3,4}/model.bpmn reconstructed the "Emergency
attendance process" as seven tasks in sequence with a vehicle XOR at the end. The page's diagram
(simulationexample2.png, the same process across all four levels), the one all four model.bpmn
files reproduce today, is:
Recieve Emergency Report (4 min) → Classify Triage (5 min) → XOR "Triage type"
  ├ Red    50 % → AND ( Manage patient entry 11 min ‖ Pick up patient 20 min ) → Authorize Entry 4 min → end
  ├ Yellow 30 % → Arrive at patient place QAV  7 min → end
  └ Green  20 % → Arrive at patient place BA  10 min → end
Measured consequences: with the sequence there is a single 51-54 min path (against the published
16 / 33 / 25 min), and the nurse spends 16 min per case instead of 10.5 (5 min always + 11 min only
on the 50% Red path), i.e. 3.2 nurses of load against 2.1 — which is why it saturates at 99.9% with
three, when Bizagi publishes 69.75%. With the official topology, the three level-2 numbers come out
exact, and the level-3 utilization of all six resources matches within 4%. It was an erratum in the
replica (LILA-010), not in the engine: LILA-187 fixed it in model.bpmn and added to the scenario
the Triage type gateway probabilities published in prose in level_1_example.htm.
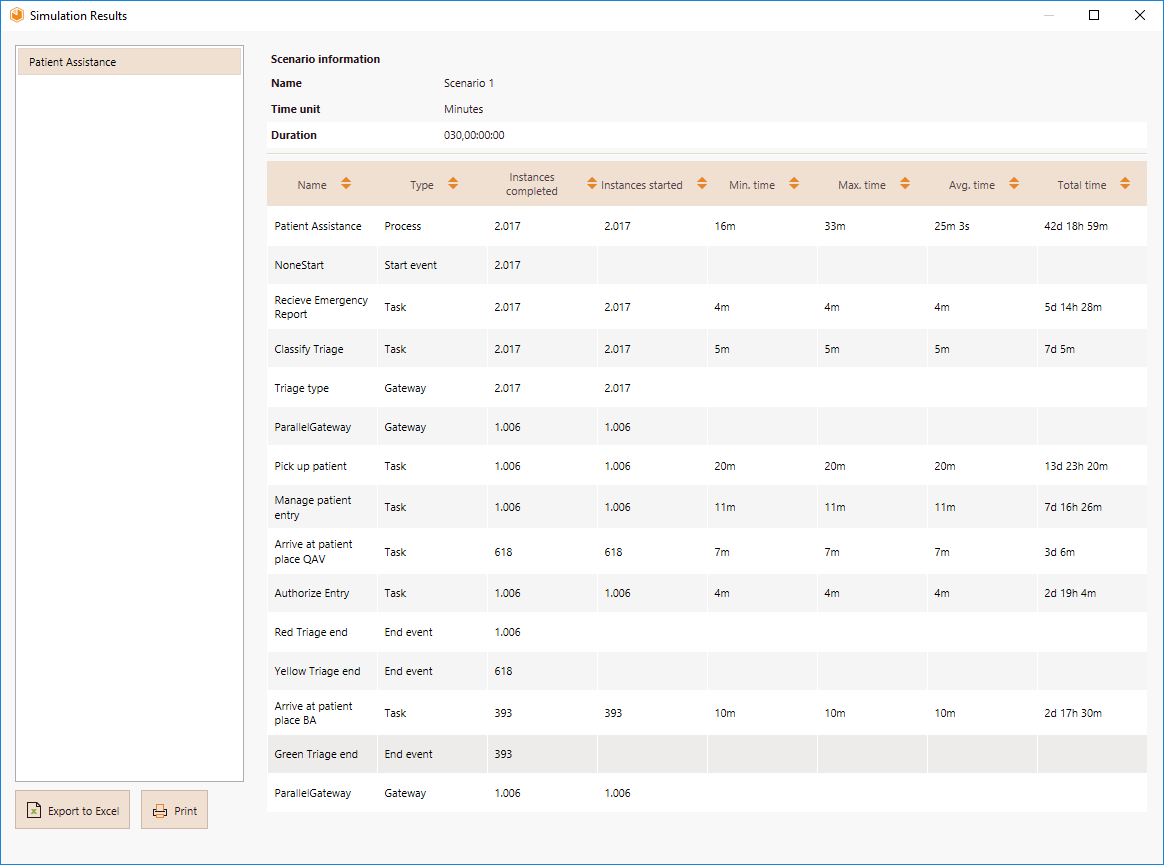
D4 — constant arrivals and draining (resolved in LILA-187). The published run
(processvalidation47.png) shows
exactly 2017 instances started and 2017 completed (10080 / 5 + 1), with Duration
030,00:00:00 in the report header: 30 wall-clock days for one week of arrivals, meaning Bizagi let
the run drain: impossible with a Poisson of mean 5 min, and proof that the example used the
constant 5 min interval control, not the exponential distribution the published scenario
declares. Bizagi also drains the run (0 cases in flight), while the published scenario cuts off at
one week and leaves cases in flight that, per LILA-036, do not enter the means. With a constant
interTriggerTimer of 300 s, triggerCount 2017, and no duration (R-ARR-3: the run ends when the
heap empties) — which is what today's level 2, 3, and 4 scenario.json files declare — Lila
reproduces the 2017 instances and Bizagi's utilization denominator: callCenterAgent comes out at
39.91% against the published 39.91%.
D5 — the level-3 maximum with 3 nurses (−5.3%). Bizagi publishes 35 min = the Red path's 33 min
plus a 2 min nurse wait that, in its run, fell on the critical path. In ours the maximum wait for
Classify Triage is on the order of seconds, and the maximum stays at the pure path's 33 min. This
is the tail of a single maximum's distribution, not a definitional difference: the mean matches
within 0.74% and the utilization within 0.14%.
D6 — the saturated level-3 case (2 nurses), mean +23.5%. With 2 nurses the system is over capacity (ρ ≈ 1.05) and the queue grows throughout the whole run, so the mean depends on the transient's shape, not on a steady state. Minimum (+0.4%), maximum (+1.3%), and utilization (−0.13%) all match; the mean does not, because in Bizagi the wait's mean/maximum ratio is 0.40 and in Lila it is 0.49 — meaning Bizagi's queue grows sublinearly and Lila's grows linearly, which is what produces a constant build-up of work from t = 0. Without Bizagi's original run there is no way to go further; it remains level 3's only residual.
D7 — level 4: per-shift capacity resolved (LILA-164), the utilization denominator still open. Bizagi varies its staffing by shift (2 / 2 / 1 call-center agents, etc.) without the resource ever ceasing to exist: the three shifts cover the full 24 h and there is no closed time.
What LILA-164 closed. Until then, SCENARIO_FORMAT.md v1 did not support this, and the replica
modeled it with three pools — one per shift, each with its own calendar — selected with
selection: "or". The side effect was measured: the task's effective calendar became whichever
shift was granted (R-CAL-4), work paused when the shift closed, and an offHoursWait of
59.7 min per case showed up, which under Bizagi's semantics has to be 0; the mean cycle time came
out at 84.4 min (+232%), and utilization and cost were published per shift instead of per role.
R-CAL-11 (resources[pool].capacity: [{ calendar, capacity }], docs/SEMANTICS.md § 12) is a
single pool per role, with the page's «Resource | Morning shift | Day shift | Night shift»
table applied segment by segment, and with it:
offHoursWait= 0 across the four tasks with a per-shift resource (the union of the three shifts is a 24×7): that was the entire deviation;- mean cycle time 1,521.5 s against the published 1,526 s (−0.30%);
- utilization and cost are reported per role, six rows, matching Bizagi's, with all twelve
numbers falling within ±5% (worst case −2.60%,
Quick Attention Vehicle); Arrive at patient place BAqueues again (max 970 s) because capacity drops to 1 during the afternoon shift; with level 3's fixed capacity it was exactly 0.
What is still open: the denominator. At level 4, Bizagi divides by the scenario's declared
duration (43,200 min = the report's Duration field of 30 days), not by the run's end instant
(≈ 10,862 min), which is what it does use at level 3 and what R-CAL-9 fixes. That is a 4.0×
difference. This is a contract decision, not a bug, and Lila does not change denominators: it
keeps [warmup, t_stop], the window it actually measured over. The conversion is exact over
busyTime:
util_bizagi = busyTime / Σᵢ (capacityᵢ × openTimeᵢ over the declared duration)
            = util_lila × lila_window / declared_duration
and with the three 8 h shifts that sum equals (Σᵢ capacityᵢ / 3) × 43,200 min, which is literally
the published calculation: Call center agent 8,068 min / ((2+2+1)/3 × 43,200 min) = 11.21%, exact
to the second decimal for all six resources against
calendaranalysis2.png.

Applied, all six rows match comfortably (the table above): −0.04% · +0.54% · +1.06% · −2.60% ·
+1.33% · +0.98%. The second form — the rule-of-three util_lila × window / declared_duration — is
the back-of-envelope version and only matches exactly when the window covers a whole number of
shift-pattern periods; here it does not (the run drains at 10,862 min, 7.54 days), and the bias from
cutting mid-segment reaches 1.8% for quickAttentionVehicle, the role whose afternoon shift is
worth double the other two. The test checks both and caps that difference at 3%: it is the
rule-of-three's error, not the engine's.
Residual: the two Arrive at patient place BA waits. Maximum 970 s against the published 900 s
(+7.8%) and mean 33.5 s against 44.4 s (−24.5%). These come from a single Bizagi run over a pool at
5.6% utilization, where a queue only forms when two cases coincide during the afternoon shift (a
single basic ambulance); that run's per-branch split is not ours either (Bizagi 403 BA instances,
Lila 409). This is noise from the reference run, of the same kind as D2, and the tolerance is not
relaxed because of it.
Mapping note (fixed in LILA-187). expected.json called waitTimeSeconds what Bizagi's table
titles «Min./Max./Avg. time» for the process. That column is cycle time (processing + wait),
and its Lila equivalent is process.cycleTime, not process.waitTime (which is only
resourceWait + offHoursWait and, at level 2 with no resources, is 0 by R-DEG-1). The field is now
called cycleTimeSeconds in all four expected.json files.
D8 — the two vehicles are swapped in the page's requirements table (resolved in LILA-187).
Level 3's «Activity | Resource | Quantity» table assigns «Arrive at patient place QAV → Basic
ambulance» and «Arrive at patient place BA → Quick attention vehicle», and the replica reproduced it
verbatim. The diagram's lanes and the published results say the opposite: in
resourcesanalysis3.png Quick
Attention Vehicle comes out at 21.40%, which is 618 × 7 min / (2 × 10,108 min) — the QAV task — and
Basic Ambulance at 19.44% = 393 × 10 min / (2 × 10,108 min) — the BA task. Under that reading, all
six denominators give the same run-end instant (10,108 min with 3 nurses, 10,591 with 2), which
confirms both the busy / (capacity × t_end) formula and the swap.

For utilization the swap only exchanges two labels, because both pools have capacity 2. For
cost it does not: the rates differ (25 and 0.3/h against 18 and 0.22/h), so with the swap the
replica billed the QAV task at 25/token instead of 18 and the BA task at 18 instead of 25 (measured
then: +36.0% and −25.1%). LILA-187 set the assignment in scenario.json that matches the published
costs, and the two costs move to −2.08% and +3.96%.
See also: docs/COMING-FROM-BIZAGI.md (the user-facing guide for people
arriving from Bizagi Modeler: the four levels as Simulate steps, screen-by-screen map, and the
differences above in plain language).
See also: docs/RESULTS_FORMAT.md (definition of the output columns mentioned in "Per-element
outputs"/"Per-resource outputs"), docs/BPMN_EXTENSION.md (lila: namespace and ids),
docs/DECISIONS.md (the ADRs behind these decisions), and BACKLOG.md (breakdown into tickets per
milestone).